

The food cost you calculate at month-end is an autopsy
The short version
- The formula was never the hard part: ingredient cost divided by the revenue it produces, times one hundred.
- The 28-35% band quoted in almost every English-language guide has no traceable primary source. The one sector figure this article can actually cite is Italian.
- A food cost rebuilt at month-end from invoices measures decisions you already made, on food you already paid for.
- The variable that matters is not precision but latency: how many days pass between a price moving and you noticing.
- If the unit price lives on the purchase order rather than the invoice, the number moves when the price list moves.
- Real time costs data discipline. Without current recipe cards, an honest weekly review beats a live dashboard fed badly.
How the food cost formula actually works, in two minutes
Restaurant food cost is the cost of the ingredients divided by the revenue those ingredients produce, times one hundred. The same formula runs at two levels, and it is worth keeping them apart, because they answer two questions that do not overlap.
At the level of a single dish, you take the cost from the recipe card and divide it by the menu price. A carbonara that costs you $3.10 in ingredients and sells for $14.00 runs at about 22%. (That arithmetic is illustrative — your guanciale is not our guanciale.) This is the theoretical food cost: what the dish should cost if nothing were wasted and every portion came out the same weight.
At the level of a period, the ingredients of the formula change but the shape does not: beginning inventory plus purchases minus ending inventory, divided by net sales over the same period. This is the actual food cost: what the food really cost you, with waste, trim, over-portioning, spoilage and short deliveries all baked in.
The gap between the two is not a bookkeeping error to be reconciled away. It is the densest piece of information you own. If theoretical says 28% and actual says 34%, those six points are a list of things happening between the walk-in and the plate, and each one has a return address: a recipe card written from memory, a portion size nobody checks, a delivery that came up short and got invoiced in full.
That is where most guides on food cost stop, and they are not wrong about any of it. The rest of this article is about something they leave out: when the number shows up.
What counts as a good food cost percentage
There is no single correct food cost percentage, and the benchmark band you have read everywhere rests on thinner evidence than its repetition suggests. The 28-35% range appears in article after article, and in tracing it back for this piece we could not land on a primary source that publishes it — it circulates, which is not the same thing as being measured.
One sector figure can be cited honestly, and it is explicitly Italian: FIPE's Rapporto Ristorazione 2026 puts Italian foodservice in a band of roughly 28-32%. That is real, published data about the Italian market. It is not a global benchmark, and it is a median calculated across formats that have almost nothing in common with each other.
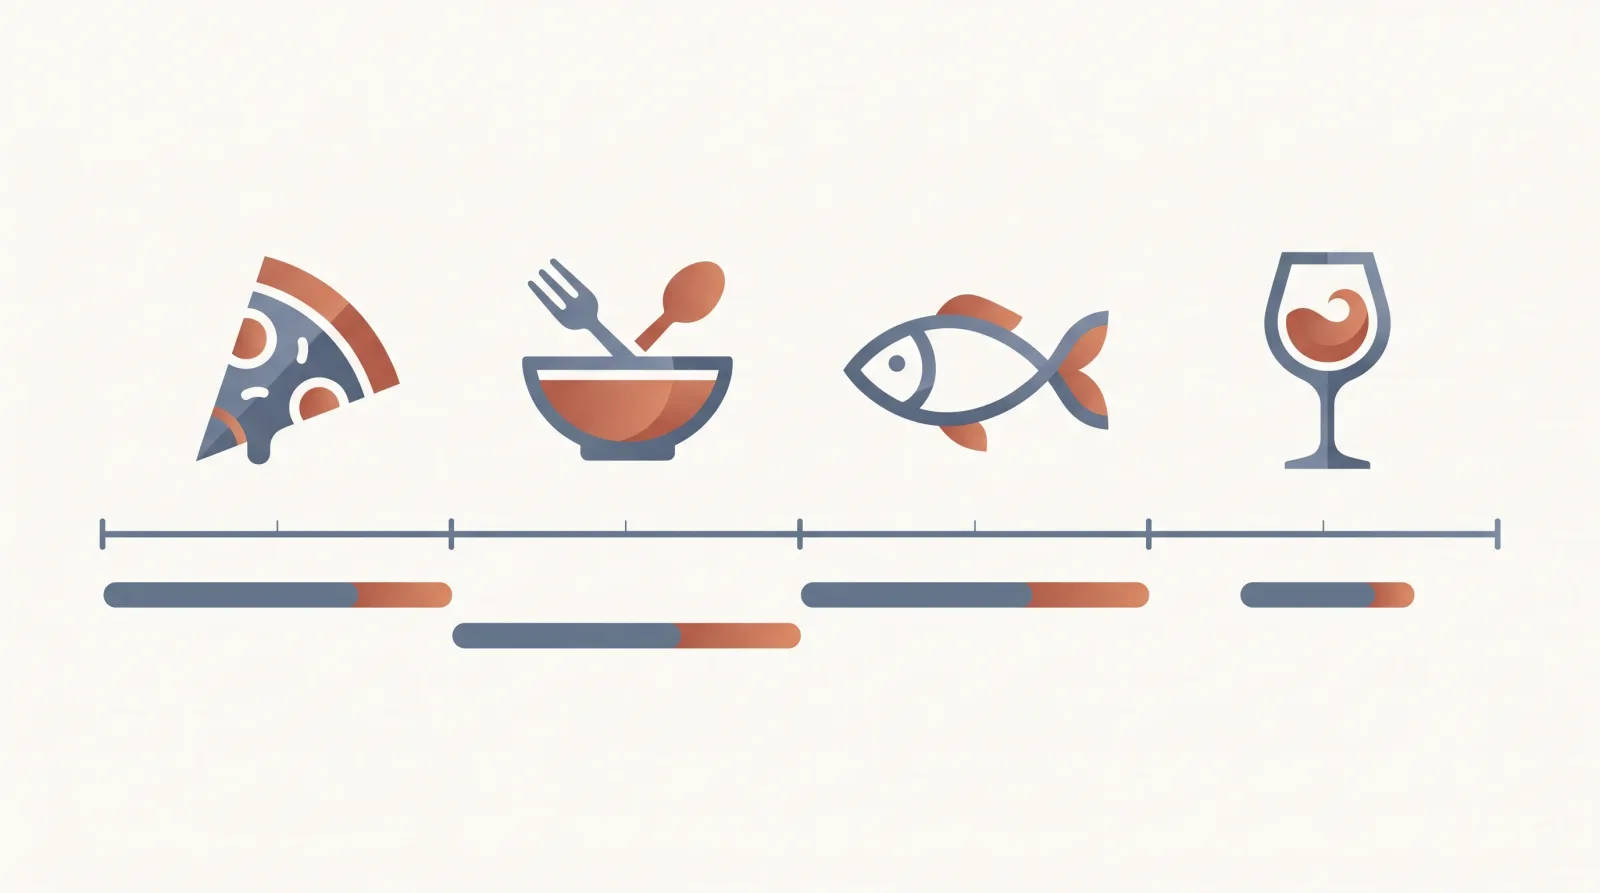
Consider the spread inside any such average. A pizzeria working from flour, tomato and mozzarella sits structurally below the band. A restaurant buying whole fish — volatile pricing, heavy loss once it is broken down — sits above it more or less by definition. Neither operator is doing anything wrong.
There is also an arithmetic problem the benchmark hides. A percentage does not pay rent; absolute margin does. A dish running 35% at $26 leaves more money in the drawer than a dish running 25% at $9, and if you optimize the percentage without looking at what actually sells, you will end up pushing the wrong plates. That is why food cost should always be read next to the product mix rather than on its own.
The comparison worth making is against yourself. Your March food cost against your June food cost, on the same menu, tells you something you can act on. Your food cost against a national average tells you where you sit in a distribution. If you want a target, take your best month of the last twelve and ask why that month went the way it did — the answer is almost always a concrete, repeatable event rather than an industry mean.
It works in the other direction too. If your number has been flat for a year while your suppliers' price lists have moved, you are probably not controlling costs well. You are more likely costing against old prices.
Why the month-end number always arrives too late
A food cost rebuilt from supplier invoices arrives after the food has been ordered, delivered, cooked, sold and paid for. Its defect is not precision. Its defect is latency, and you can count it in days.
Your purveyor updates the price list on the 3rd. You order on the 5th without reading it, because you have ordered the same twelve items for six years. The delivery lands on the 6th. The invoice goes out on net-30 terms, your bookkeeper posts it somewhere in the second week of the following month, and your food cost spreadsheet updates whenever you find forty minutes to update it. Thirty days is the good case. Forty-five is the normal one.
Inside those forty-five days you have already made, without knowing it, every decision that number was supposed to inform. You reordered the same item five or six more times at the new price. You kept the dish on the menu at the same price. You may even have run it as a special, because it moves well — and it moved well precisely because it was priced against a cost that no longer exists.
The two questions a food cost is supposed to change are: do I keep buying this item from this supplier? and does this dish stay at this price? Both of them are asked before. A number that arrives afterward cannot answer either. It can only explain why the month came in worse than it felt while you were living it.
There is a version of this that plays out every summer. Say your fish supplier moves one item up by a fifth, because that is the season. The dish built on it is the second-best seller on the menu. For six weeks you keep selling it with the same enthusiasm, because in your head the cost is still what it was in April. At the end of August, the food cost for that dish will report with great accuracy that you gave away margin on several hundred covers. The number will be exact. It will also be useless.
That is the whole point. A food cost that does not update when prices update is not a control, it is a postmortem. It describes something finished, and no additional decimal place turns a description into a decision.
Cost from the purchase order, not from the invoice
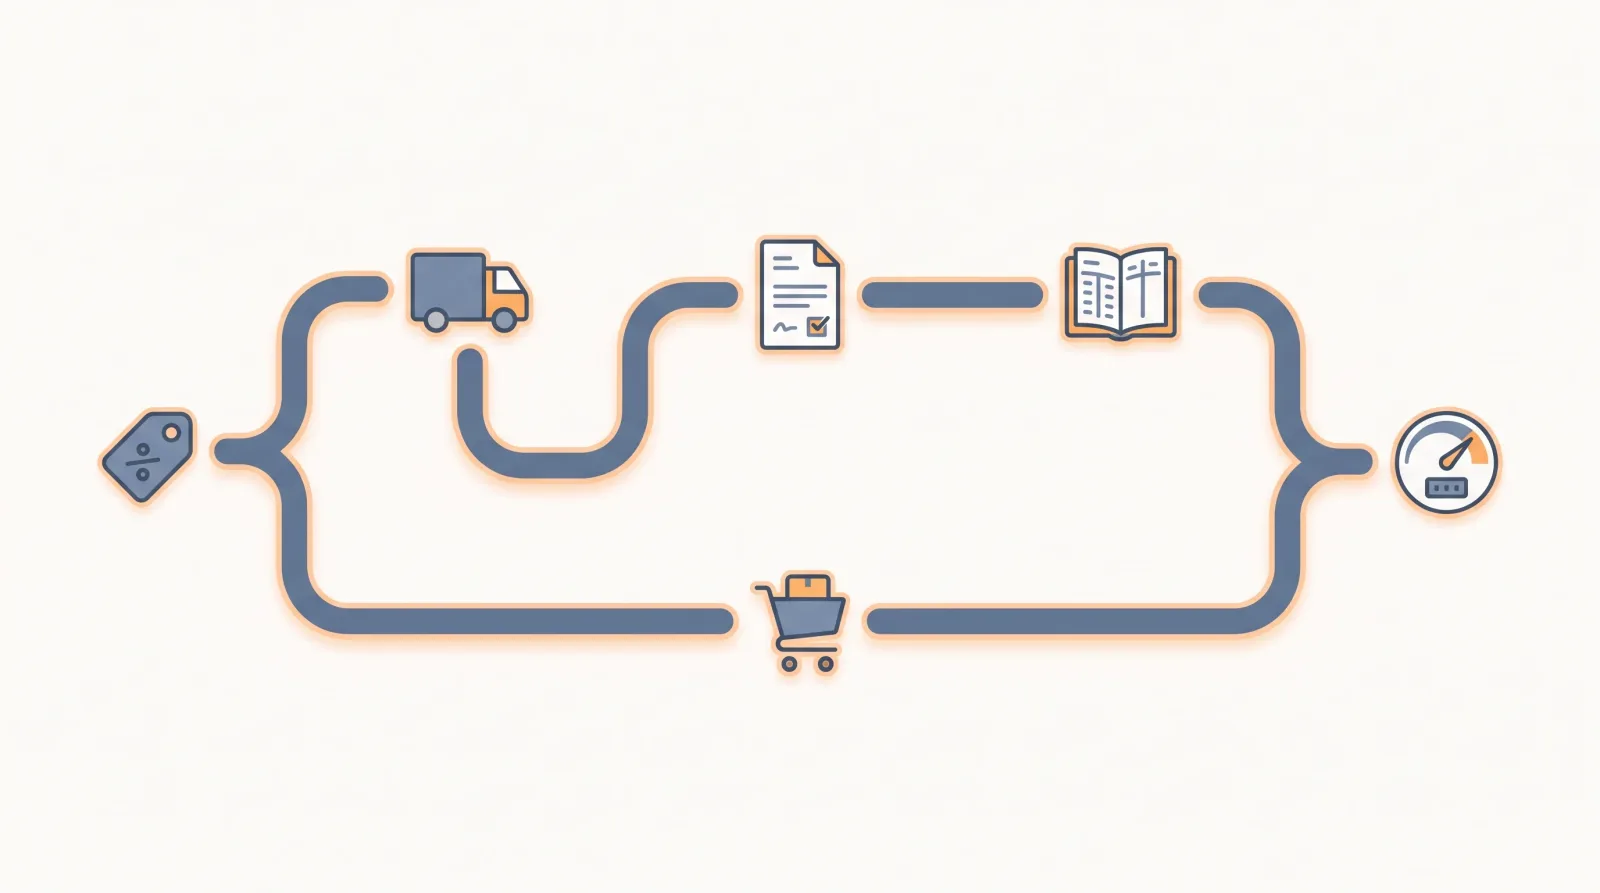
The purchase price exists long before the invoice does. It exists in the supplier price list, and it exists in the order you already sent. If your food cost calculation reads that source instead of the ledger, the number recalculates the moment the price list moves rather than six weeks later. This is not a question of sophisticated software. It is a question of where the unit price lives.
Three things have to be true for it to work, and each one is worth checking before you buy any tool at all.
A shared item master between ordering and recipes
The item you order from the supplier and the ingredient on the recipe card have to be the same row in the same list. This is where it breaks, almost every time: the kitchen card says "guanciale," the order line says "GUANCIALE STAG 24M SS VAC ~1.5KG," and neither system has any idea they refer to the same product. Until that link exists, automatic food cost is impossible no matter what you buy.
Explicit purchase units and pack size
You buy by the case, the carton, the sack. You cook by the ounce and by the piece. That conversion factor gets written once, and it has to be written correctly, because it is the leading cause of the absurd food costs that make everyone stop trusting the report. A six-count case treated as a single unit produces a cost wrong by a factor of six, and trust in a dashboard is lost exactly once.
Price history per item
You need today's price to calculate, and you need the series behind it to notice that something moved. A price without history gives you a number. A price with history gives you a signal.
With those three in place, food cost stops being a monthly report and becomes an attribute of the dish, one that changes when an input changes. You reprice the guanciale on Thursday's order and by Thursday night you know which dishes crossed your threshold. It is the reason the unit price in mayo lives on the supplier order rather than in a separate archive: keep it there, and the rest is arithmetic.
One warning that saves weeks. Do not try to map the whole storeroom at once. Take the twenty items that carry most of your purchasing — the handful that eat the bulk of the spend — and link only those. A food cost calculated on those twenty items is already fresher than one calculated on everything at month-end.
Three weekly checks worth more than another decimal
Three weekly checks move margin further than any refinement of the food cost formula, and none of them takes more than fifteen minutes.
Yield loss, meaning gross weight against net weight. Recipe cards written in a hurry use as-purchased weight: 8 oz of artichokes. Trimmed down, less than half of that ever reaches the pan. If the card reasons on gross weight while the cost is computed on net — or the reverse — your theoretical food cost is wrong in the same direction every single time, and because the error is consistent, you never see it. Check the low-yield categories first: whole fish, bone-in meat, artichokes, citrus you are juicing. Run the yield test once with a scale, write the factor on the card, and forget about it for a year.
Price variance per item. Do not look at all your prices. Look only at the ones that moved against the previous order. Five percent is a reasonable starting threshold; raise it if it buries you in noise. What you are hunting is not the big increase, which announces itself, but the small repeated one: three moves of 4% across two months are not news on any of the three days they happen, and together they are more than twelve points.
Dishes over threshold, crossed with what sold. A list of dishes above your food cost threshold is, on its own, a list of suspects. It becomes a list of priorities when you multiply each one by the portions sold in the period. A dish at 41% that sells twice a week is a theoretical problem. A dish at 33% that sells ninety times is where your margin actually is. Work in order of volume, not in order of percentage.
The honest objection — real time has a price
A continuously updated food cost costs data discipline, and that is the part nobody sells you. If your recipe cards are three years old, if half the menu never had one, if your item master is a list of descriptions typed by hand — a live dashboard will hand you wrong numbers faster, and a dashboard only gets to lose your trust once.
The test is crude and it holds up: if you do not have reliable recipe cards for the dishes that make roughly 70% of your sales, this week's work is the cards, not the software. In that situation a weekly review done by hand on your top twenty purchased items is worth more than any automation, and it is also the fastest way to find out whether you needed real time at all or whether your real problem was that nobody was reading the prices.
And if the cards are there, the question stops being what is my food cost. It becomes how many days do I take to know it. That is the one figure in this article you can do something about on Monday morning.
Sources
- FIPE — Confcommercio, Rapporto Ristorazione 2026 (Italian foodservice sector data): https://www.confcommercio.it/-/fipe-rapporto-ristorazione
Keep your spending under control with mayo
Up-to-date price lists, centralized orders and prices verified on every delivery. Try it with your team.
Keep reading
There Is No Ideal Food Cost. There Is Only Your Format
The 28-35% food cost band everyone repeats describes full-service restaurants and nobody else. A pizzeria and a bar are measured wrong by it, in opposite directions.